How to Monitor FPS and Temperatures While Gaming: the 4 Free Tools Worth Using
To see FPS and temperatures for free, the overlay already built into Steam covers most cases in under a minute and installs nothing. If you need real data —1% lows, GPU hotspot, actual clocks— the reference combo is still MSI Afterburner with RivaTuner. No paid app measures more.
What to measure, and why average FPS lies
Almost everyone watches one number: FPS. It’s the worst place to look if you want to understand why your PC feels off.
What matters is frametime, how long each frame takes to draw. At a steady 144 FPS, each frame takes 6.9 ms. If 99 frames take 6.9 ms and one takes 40 ms, the average barely moves —you still see “143 FPS”— but you felt the hitch. That long frame is the stutter, and average FPS won’t show it to you.
That’s why serious testing uses 1% lows: the value below which the slowest 1% of frames in the session sit. A 120 average with 100 for 1% lows is a smooth game; a 120 average with 45 for 1% lows is a consistency problem, whatever the counter says. GamersNexus has spent years explaining why that metric changed how hardware gets measured.
Temperatures work the same way: the one-second peak doesn’t count, the sustained temperature over 20 or 30 minutes does, alongside what the clocks are doing meanwhile. A GPU at 84 °C holding its MHz is working as designed; one at 84 °C that has shed 300 MHz is temperature-limited.
Four numbers and that’s it: average FPS and 1% lows (real smoothness), CPU and GPU temperatures plus hotspot if your card reports it, CPU and GPU utilisation —what gives away a bottleneck— and clock speeds, which dropping under heat means throttling.
The four free tools worth using
| Tool | What it measures | Effort | Who it’s for |
|---|---|---|---|
| Steam overlay | FPS, real vs DLSS/FSR generated frames, CPU and GPU usage and temps, RAM | 30 seconds, already installed | Almost everyone |
| NVIDIA App / AMD Adrenalin | FPS, temperatures, clocks, latency (NVIDIA) | 1 minute, already installed | Anyone wanting vendor data with no extra install |
| MSI Afterburner + RivaTuner | All of the above plus hotspot, VRAM, power draw, per-core, history graphs | 5-10 minutes of setup | Diagnosing, overclocking, undervolting |
| CapFrameX | 1% lows, 0.1% lows, frametime graph, CSV export | 10 minutes | Comparing before and after a change |
Steam overlay: the one you already have
Valve took its performance monitor out of beta and pushed it to everyone on 1 July 2025. It lives in Steam → Settings → In Game → Performance Monitor, with four detail levels running from a bare FPS counter to full FPS + CPU + GPU + RAM.
It does something the others don’t: it separates real frames from generated ones with DLSS or FSR. If you play with frame generation, that “180 FPS” may be 90 real and 90 interpolated, and how the controls feel matches the 90. It’s the most direct way to see it without relying on your GPU vendor’s app (the NVIDIA App also reports it, but inside its DLSS statistics view).
Limitation: it works best on Windows with recent GPUs, and it won’t appear outside Steam.
NVIDIA App and AMD Adrenalin: they ship with the driver
The NVIDIA App replaced GeForce Experience and no longer asks for an account. Alt+R opens the statistics overlay and Alt+Shift+R cycles views: FPS, clocks, temperature and render latency. On Radeon, Ctrl+Shift+O opens Adrenalin’s Metrics Overlay. TechSpot benchmarked the cost of leaving NVIDIA’s statistics overlay running and it’s effectively zero.
MSI Afterburner + RivaTuner: the standard for a decade
Afterburner (stable 4.6.6, October 2025) does the measuring; RivaTuner Statistics Server —RTSS, version 7.3.7, installed alongside it— draws the overlay. Both are free and work with any GPU, MSI or not.
Minimum setup, once:
- Install Afterburner and let it install RTSS with it.
- Gear icon → Monitoring tab. Tick and enable “Show in On-Screen Display” for: GPU temperature and usage, CPU temperature and usage, core clock, GPU memory used, and framerate.
- OSD tab: bind a key to show and hide the overlay.
- Play for 20 minutes and check the history graph when you quit. The information is there, not in the flickering number.
If you need sensors Afterburner doesn’t carry (VRM, individual cores, SSDs), install HWiNFO64 and let RTSS draw its sensors. Free, and it’s the route HWiNFO’s own forum recommends.
CapFrameX: when you actually want to compare
CapFrameX is a free wrapper around Intel PresentMon: it records the session and gives you average, 1% lows, 0.1% lows and the frametime graph, with any GPU brand. It’s the only tool here that lets you prove with data whether a change —new driver, different RAM, cleaning the case— did anything.
Which numbers are normal and which aren’t
| Reading | Normal while gaming | Watch it | Act |
|---|---|---|---|
| Ryzen 7000/9000 CPU | 60-85 °C | 90-95 °C sustained | 95 °C is its design TjMax, not a fault; living there means the cooler is undersized |
| Intel 12th-14th gen CPU | 60-90 °C | 95 °C+ | 100 °C is its TjMax: constant throttling and lost FPS |
| Intel Core Ultra 200S CPU | 60-90 °C | 100 °C+ | Intel raised its TjMax to 105 °C; throttling starts there |
| GPU (core temperature) | 60-85 °C | 85-90 °C | Above that, check case airflow |
| GPU hotspot | 10-15 °C above core | 20-25 °C gap | A sustained 25-30 °C gap: degraded paste or thermal pads |
| VRAM (GDDR6X) | 80-100 °C | 100-105 °C | Junction limit sits around 105 °C; past it the card starts limiting |
| GPU usage | 95-99% | 70-90% with low FPS | Low usage plus low FPS means something else is the limit |
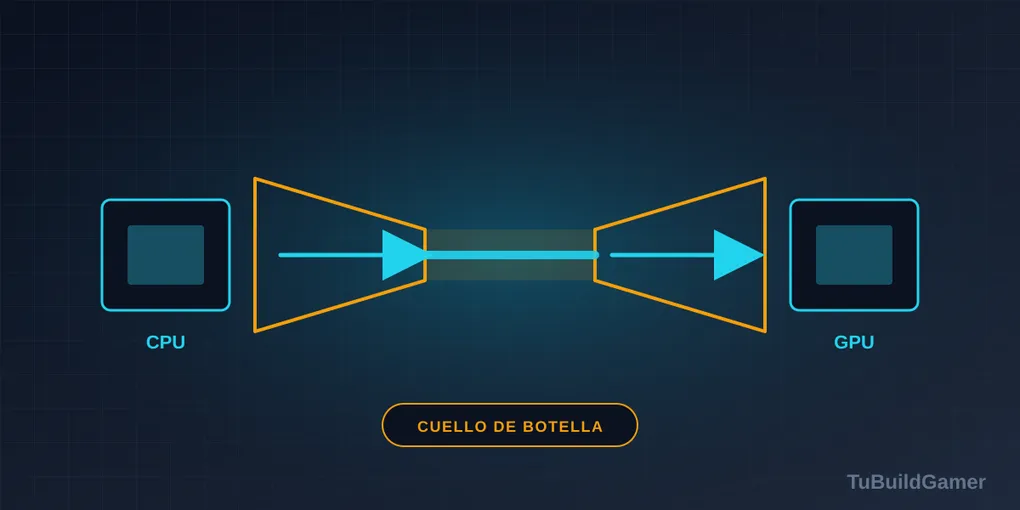
| CPU usage | Varies; watch the cores, not the total | One core pinned at 100% | A single saturated core with the GPU at 60% is a CPU bottleneck |
Two honest warnings. First: 95 °C on a modern Ryzen is not an emergency. AMD designed the boost algorithm to push voltage and frequency until it touches 95 °C and sit there; that’s the intended operating point. What it does tell you is that better CPU cooling would buy you more MHz.
Second: the hotspot scares people more than it should. Reading 95 °C while the core sits at 78 °C is normal on almost any card from the last five years. The alarm isn’t the absolute value, it’s the core-to-hotspot gap growing over the months — that points to dried paste or crushed pads, and it usually shows up after the second year.
Reading the combination: four diagnoses
Isolated numbers say nothing. Combinations do:
- GPU at 97-99%, normal temperatures, steady FPS. All fine. Your GPU is the limit, which is exactly where the limit belongs. For more FPS, drop settings or change the card.
- GPU at 60-80%, one CPU core at 100%, uneven FPS. CPU bottleneck. Raise the resolution or graphics settings and watch the FPS barely move: that’s the test.
- FPS start fine and fall after 10-15 minutes, temperature climbing and clocks dropping. Thermal throttling. On a desktop it’s almost always case airflow; on a laptop it’s normal up to a point and has its own manual.
- High average, floor-level 1% lows, GPU memory maxed out. You’re running out of VRAM and the game is spilling into system RAM. Drop texture quality and check — how much VRAM you need depends on the resolution you play at.
What isn’t worth it
- Paying for HWiNFO Pro just to see more sensors on screen. Its free overlay is capped at 5 items, true, but wiring it to RTSS removes that cap for nothing. The Pro licence makes sense for long-term sensor logging, not for gaming.
- “Optimiser” apps with a bundled FPS counter. They hand you the counter and charge you for closing Windows processes that weren’t slowing anything down. That counter is free in Steam.
- Repasting the GPU over a hotspot spike. If the core-to-hotspot gap is the same as the day you bought it, leave it alone: opening the card can cost you the warranty.
- Running three overlays at once. Steam, Afterburner and Discord fighting to draw over the game is a classic cause of stutter and crashes. Pick one.
One practical note: some kernel-level anti-cheats (Valorant’s Vanguard, certain Easy Anti-Cheat implementations) can block third-party overlays like RTSS. If nothing shows up in that particular game, it isn’t broken: fall back to the Steam overlay or your GPU vendor’s.
Frequently asked questions
Does the overlay cost FPS? The data ones, practically none. TechSpot measured the NVIDIA App statistics overlay and the impact is negligible; RTSS behaves the same. What costs performance is recording and filters, not the counter.
Do I need MSI Afterburner with an AMD or Intel GPU? Not for measuring: Afterburner works with any card, but Adrenalin’s Metrics Overlay already gives you FPS, temperatures and clocks with nothing extra installed. Afterburner wins when you want hotspot, VRAM and power draw on the same line, or you’re undervolting.
How long do I need to measure for it to mean anything? Twenty minutes of real gameplay, not a three-minute benchmark. Throttling and case heat soak take time to show up, and they’re exactly what you’re hunting.
What do I do if my CPU hits 100 °C? On an Intel 12th-14th gen chip that’s guaranteed throttling; on a Core Ultra 200S you still have headroom to 105 °C, but you’re brushing the limit. First check the cooler is properly mounted and the case has intake air; if that’s fine, the cooler is undersized. Software won’t fix it.
Can 1% lows be shown in real time? Afterburner can display live frametime, but 1% lows are calculated over a complete session: for that you need CapFrameX or PresentMon, which record first and do the maths afterwards.
Sources consulted
- Steam – In-Game Performance Monitor (official announcement, July 2025)
- Tom’s Hardware – Steam’s new performance overlay: real FPS vs DLSS/FSR generated frames (2025)
- NVIDIA – In-Game Performance and Latency Overlay (official documentation, accessed Sep 2026)
- TechSpot – Does the Nvidia App Hurt Performance? We Benchmarked It (2025)
- TechSpot – How to Use Intel PresentMon for Benchmarking and Testing
- GamersNexus – Testing Methodology: 1% and 0.1% Lows
- Guru3D – RivaTuner Statistics Server 7.3.7 (download and release notes)
- Tom’s Hardware – HWiNFO64 adds GDDR6X temperature monitoring
- Tom’s Hardware – Intel extends Arrow Lake (Core Ultra 200S) TjMax to 105 °C
- CapFrameX – official site and documentation
Published 17 September 2026. Software versions verified on that date.